Visualization
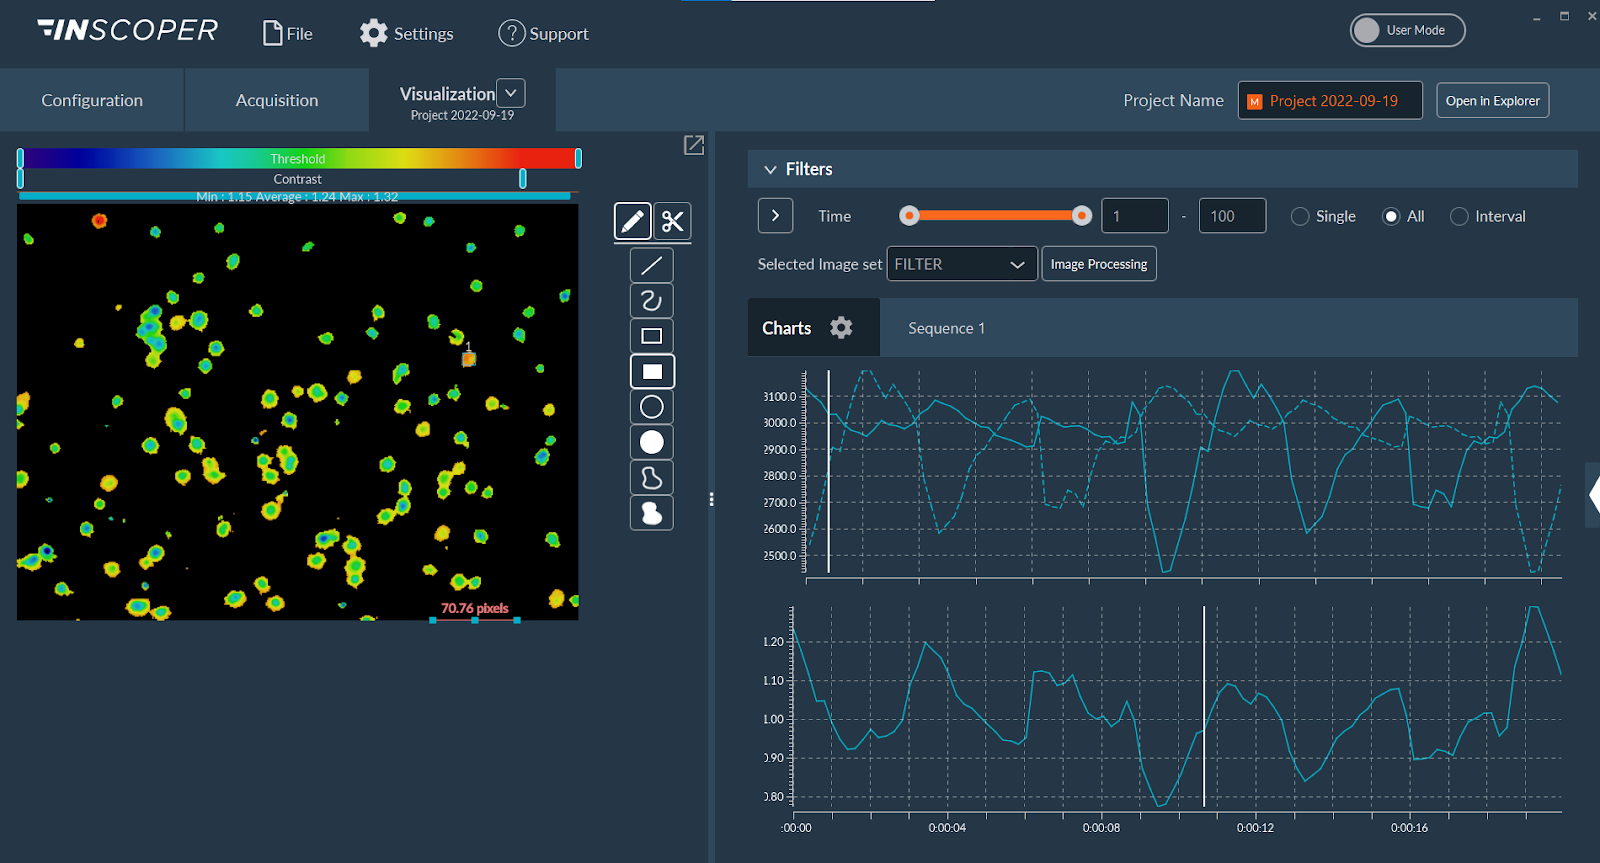
The visualisation tab gives you access to raw and rationalised data for each manually drawn ROI. The graphs are automatically updated whenever an ROI is added, modified or deleted.

The visualisation tab gives you access to raw and rationalised data for each manually drawn ROI. The graphs are automatically updated whenever an ROI is added, modified or deleted.
