Visualization
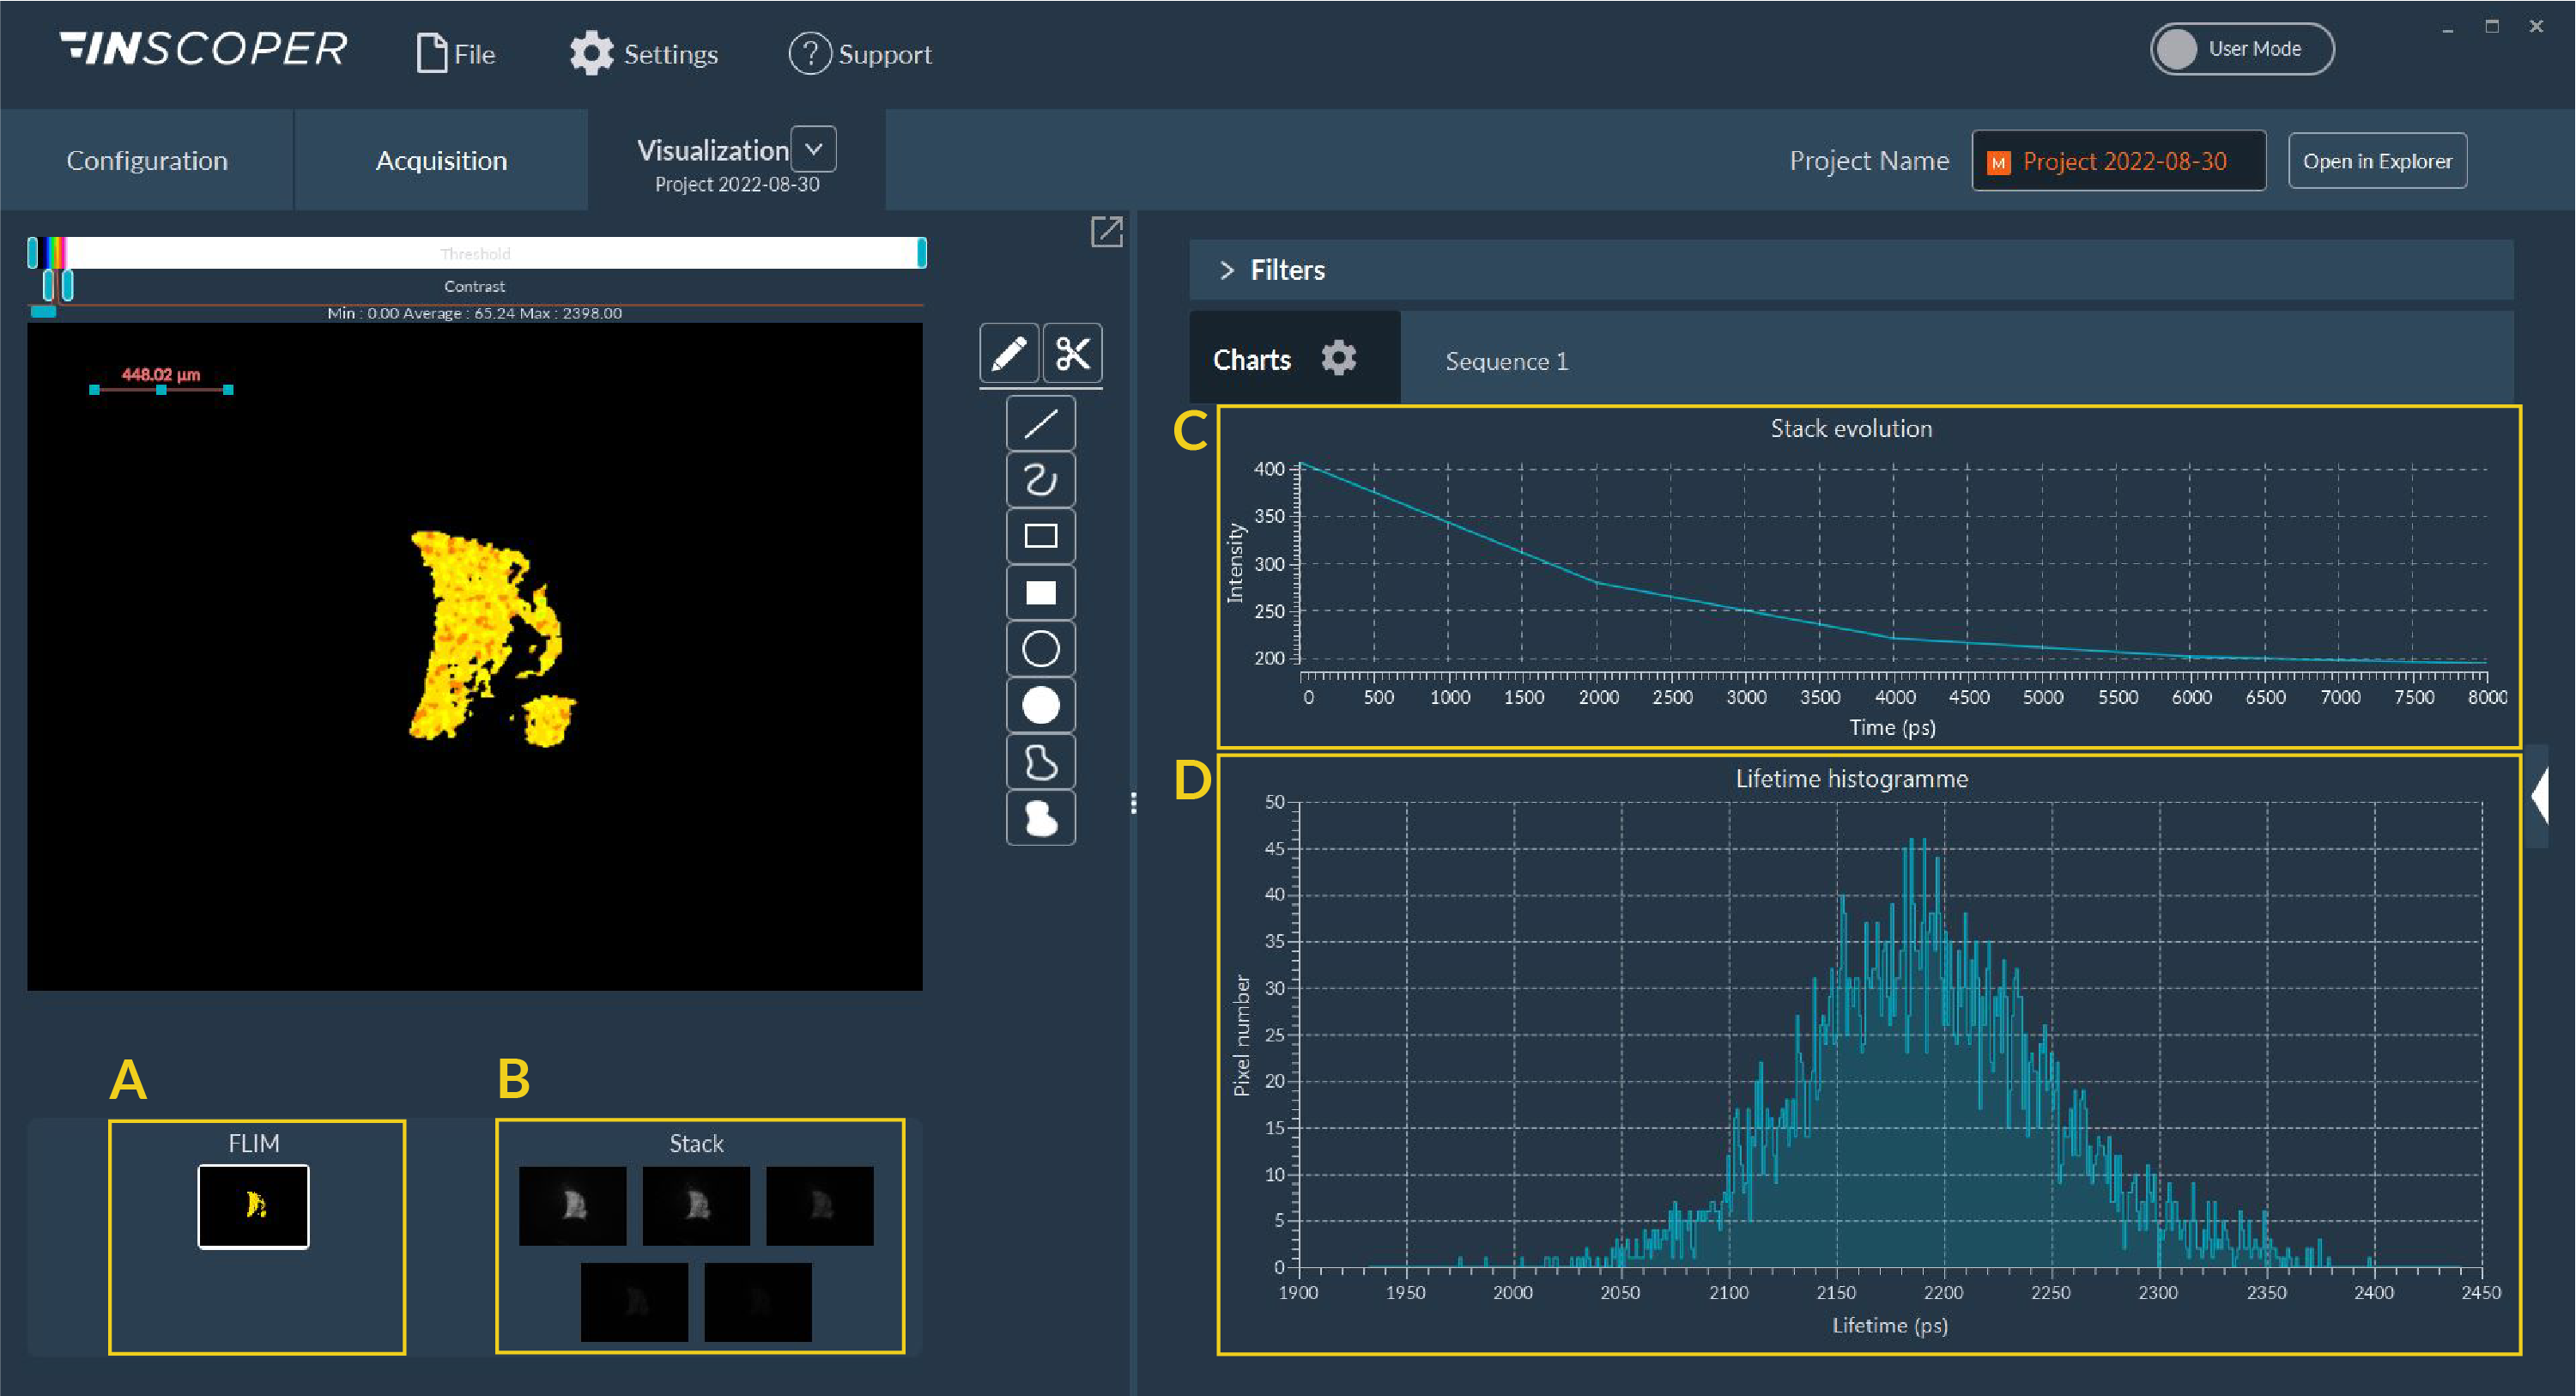
In the visualization tab, you have the result of your FLIM calculation and you have access to the FLIM, Intensity images, distribution of the lifetime and Intensity decay.
A. FLIM image
B. Intensity images used for the FLIM calculation
C. Intensity decay
D. Lifetime distribution

All those images are saved in the folder that you choose.
