Visualisation
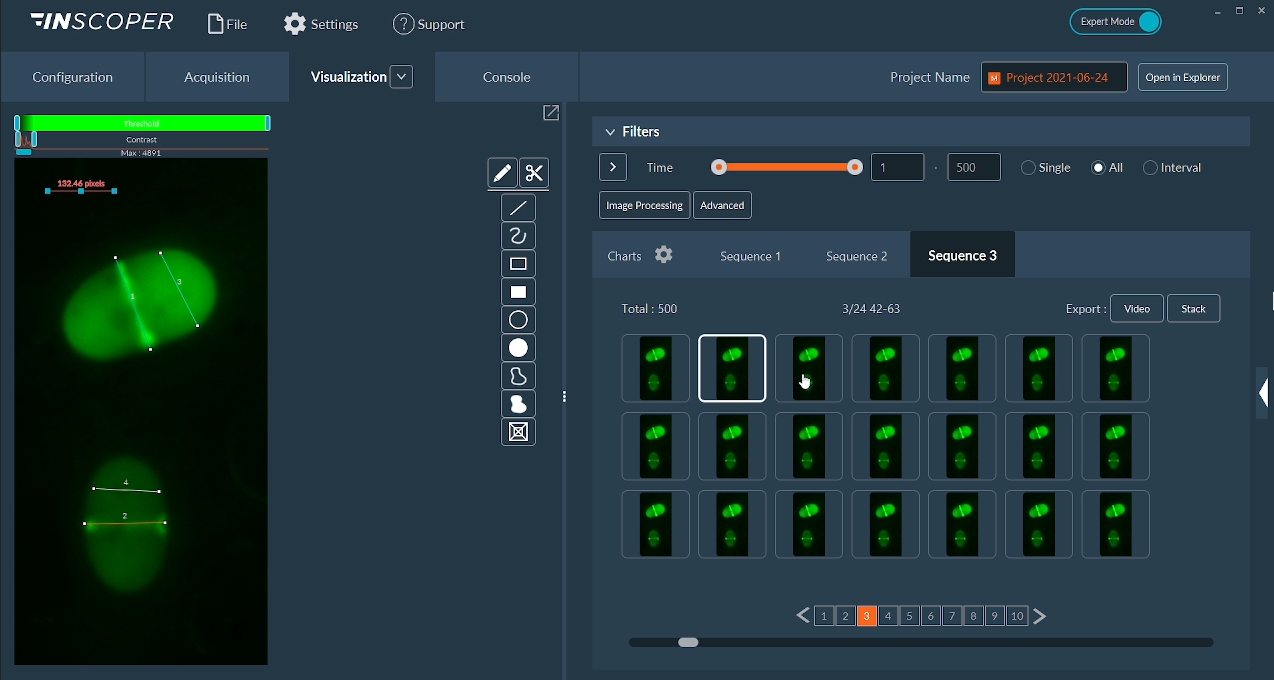
In the Visualisation tab, you will see the result of all sequences and the graph to follow your fluorescence intensity in the ROI.
In the Visualisation tab, you will see the result of all sequences and the graph to follow your fluorescence intensity in the ROI.