Interacting with graphics
You can interact with charts by changing their appearance, editing them, adding time markers, or exporting them. Simply hover over a graph to open a new tab.
It is possible to:
- move inside a graph by holding down the mouse wheel click;
- zoom in and out using the mouse wheel;
- select an area with the mouse to zoom in;
- view a specific image by left-clicking directly on the graph;
- and (v) return to the initial view by right-clicking.
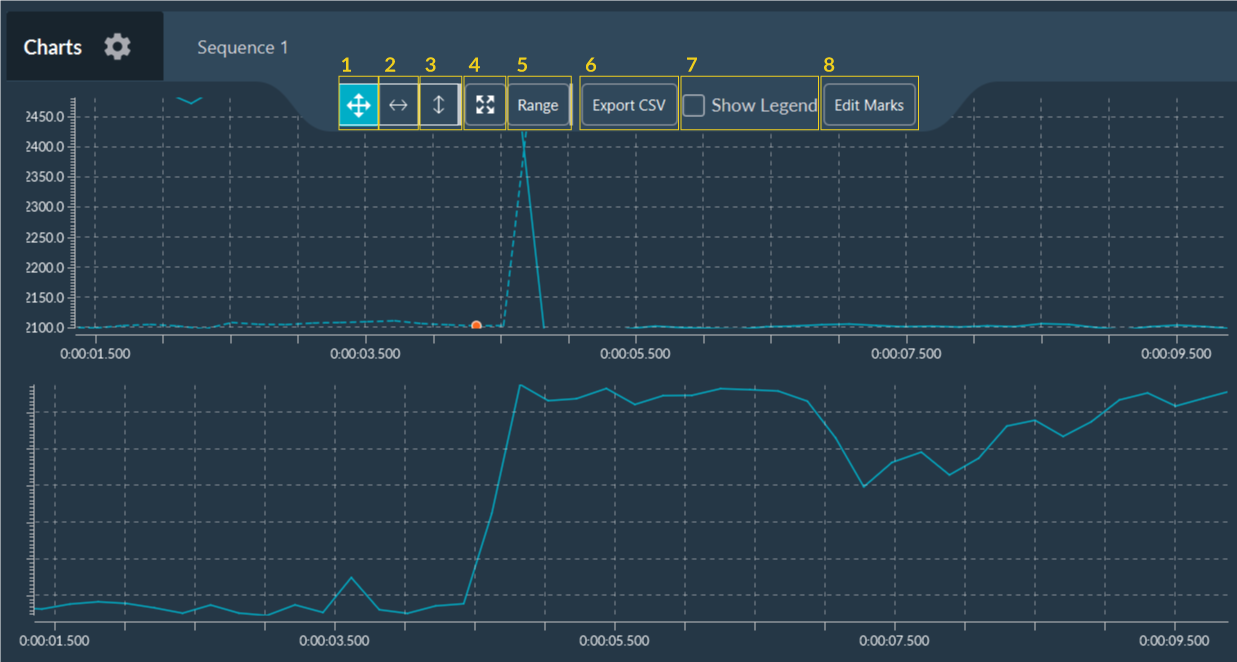
- Enable XY zoom mode.
- Enable X zoom mode.
- Enable Y zoom mode.
- Zoom to origin and enables auto-ranging
- Modify the range of XY axes values for the graph visualization.
- Export all data to a .csv file.
- Show/hide curves legends
- Tool to add some markers to the graph (see below).
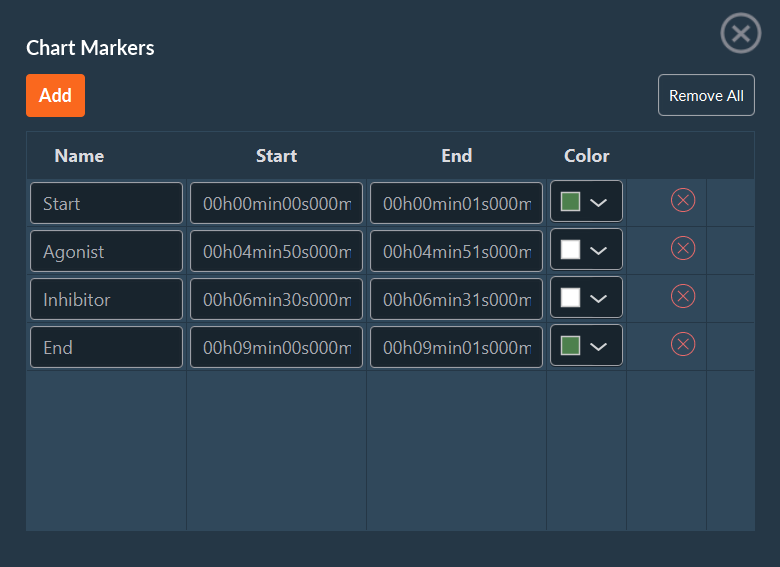
In this window you can add information about your experiment as markers. These events, which are fully customizable, can be associated with the acquisition itself (start, pause, end), external events (addition of an inhibitor, medium supplementation), or others. These markers can be saved in a .csv file and reused at any time.