liveRATIO
The liveRATIO add-on enables real-time ratiometric imaging, allowing you to quantify the ratio between two emission wavelengths over time (e.g., FRET, calcium imaging). The Ratiometric imaging data processor drives this function.
![]()
Hardware Configuration
For physical hardware and baseline channel setup, please refer to the standard Configuration section.
Sequence Acquisition
1. Wavelength Setup
- Navigate to the Multi-Channels dimension within the Acquisition tab.
- Configure two or more distinct optical wavelengths for your chronological sequence.
2. Data Processing Configuration
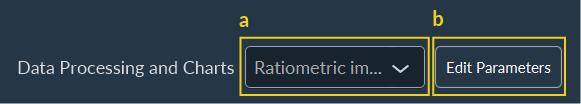
- a. Choose Ratiometric imaging_Despeckle from the Data processing and Chart drop-down menu.
- b. Click Edit Parameters to open the module's settings.
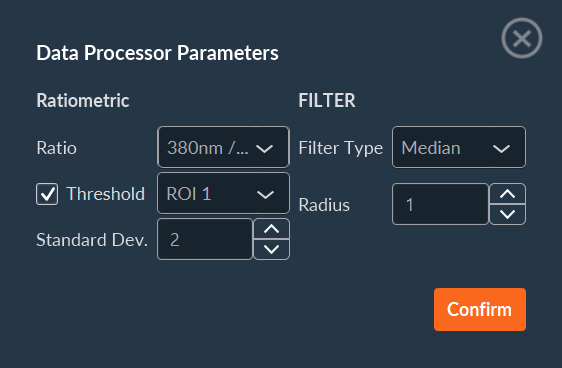
- c. Specify which channels form the numerator and denominator for your calculated ratio.
-
d. (Optional) Enable background noise removal:
- If enabled, draw a Region of Interest (ROI) in an area devoid of signal. This ROI serves as the background reference.
- Specify the standard deviation multiplier for the background subtraction threshold calculation.
-
e. Select the spatial filtering method (median or average filter).
- f. Define the radius (in pixels) for the spatial filter.
- g. Click Confirm to save your processing parameters.
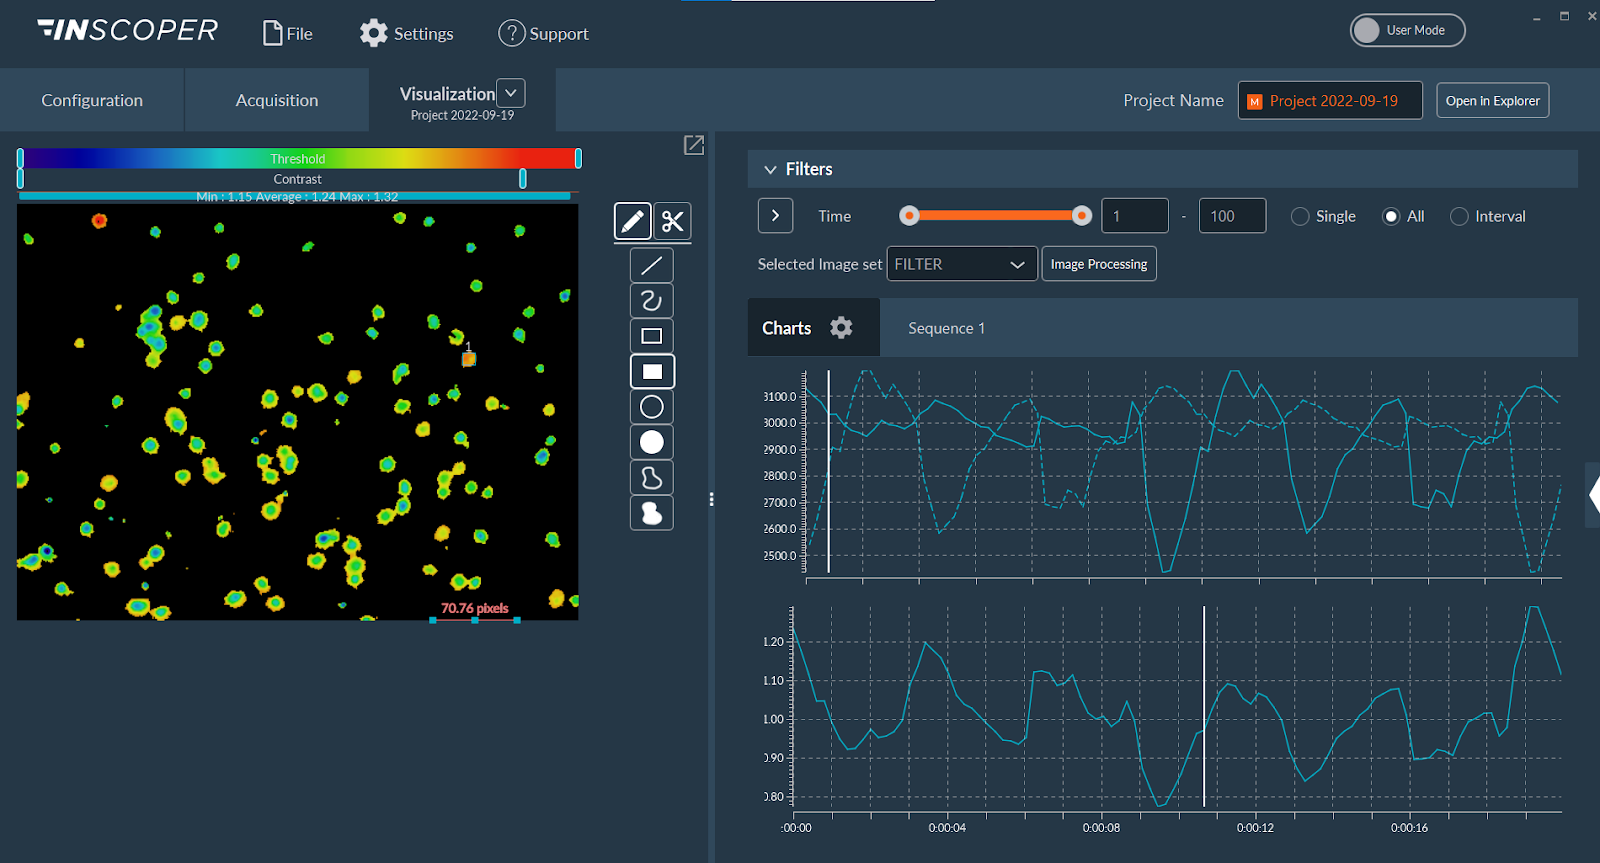
Data Visualization
The Visualization tab displays both the raw sensor intensity data and the calculated ratiometric data for any drawn ROIs. These data plots update in real-time whenever an ROI is created, adjusted, or removed.